This Blog is to share our knowledge and expertise on Linux System Administration and VMware Administration

Tuesday, June 14, 2016

NIC bonding in Vmware ESXi and ESX

Tuesday, June 14, 2016 0

To utilize NIC teaming, two or more network adapters must be uplinked to a virtual switch. The main advantages of NIC teaming are:
  • Increased network capacity for the virtual switch hosting the team.
  • Passive failover in the event one of the adapters in the team goes down.
Observe these guidelines to choose the correct NIC Teaming policy:
  • Route based on the originating port ID: Choose an uplink based on the virtual port where the traffic entered the virtual switch.
  • Route based on an IP hash: Choose an uplink based on a hash of the source and destination IP addresses of each packet. For non-IP packets, whatever is at those offsets is used to compute the hash.
  • Route based on a source MAC hash: Choose an uplink based on a hash of the source Ethernet.
  • Use explicit failover order: Always use the highest order uplink from the list of Active adapters which passes failover detection criteria.
  • Route based on physical NIC load (Only available on Distributed Switch): Choose an uplink based on the current loads of physical NICs.
Before you begin :
  • The default load balancing policy is Route based on the originating virtual port ID. If the physical switch is using link aggregation, Route based on IP hash load balancing must be used.
  • LACP support has been introduced in vSphere 5.1 on distributed vSwitches and requires additional configuration. 
  •  
  • Ensure VLAN and link aggregation protocol (if any) are configured correctly on the physical switch ports.

To configure NIC teaming for standard vSwitch using the vSphere / VMware Infrastructure Client:
  1. Highlight the host and click the Configuration tab.
  2. Click the Networking link.
  3. Click Properties.
  4. Under the Network Adapters tab, click Add.
  5. Select the appropriate (unclaimed) network adapter(s) and click Next.
  6. Ensure that the selected adapter(s) are under Active Adapters.
  7. Click Next > Finish.
  8. Under the Ports tab,highlight the name of the port group and click Edit.
  9. Click the NIC Teaming tab.
  10. Select the correct Teaming policy under the Load Balancing field.
  11. Click OK.
To configure NIC teaming for standard vSwitch using the vSphere Web Client:
  1. Under vCenter Home, click Hosts and Clusters.
  2. Click on the host.
  3. Click Manage > Networking > Virtual Switches.
  4. Click on the vSwitch.
  5. Click Manage the physical network adapters.
  6. Select the appropriate (unclaimed) network adapter(s) and use the arrow to move the adapter(s) to Active Adapters.
  7. Click Edit settings.
  8. Select the correct Teaming policy under the Load Balancing field.
  9. Click OK.
To configure NIC teaming for Distributed portgroup for VMware vSphere Distributed Switch (VDS) using the vSphere/VMware Infrastructure Client:
  1. From Inventory, go to Networking.
  2. Click on the Distributed switch.
  3. Click the Configuration tab.
  4. Click Manage Hosts. A window pops up.
  5. Click the host.
  6. From the Select Physical Adapters option, select the correct vmnics.
  7. Click Next for the rest of the options.
  8. Click Finish.
  9. Expand the Distributed switch.
  10. Right-click the Distributed Port Group.
  11. Click Edit Settings.
  12. Click Teaming and Failover.
  13. Select the correct Teaming policy under the Load Balancing field.
  14. Click OK.
To configure NIC teaming for Distributed portgroup for VDS using the vSphere Web Client:
  1. Under vCenter Home, click Networking.
  2. Click on the Distributed switch.
  3. Click the Getting Started tab.
  4. Under Basic tasks, click Add and manage hosts. A window pops up.
  5. Click Manage host networking.
  6. Click Next > Attached hosts.
  7. Select the host(s).
  8. Click Next.
  9. Select Manage physical adapters and deselect the rest.
  10. Click Next
  11. Select the correct vmnics.
  12. Click Assign Uplink > Next.
  13. Click Next for the rest of the options.
  14. Click Finish.
  15. Expand the Distributed Switch.
  16. Click Distributed Port Group. > Manage > Settings.
  17. Under Properties, click Edit.
  18. Click Teaming and failover.
  19. Select the correct Teaming policy underthe Load Balancing field.
  20. Click OK.

Explain about NIC Teaming in vmware

Tuesday, June 14, 2016 0

NIC Teaming

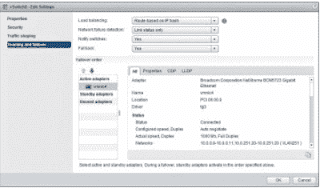
Let’s take a well-deserved break from networking math for a moment and shift into the fun world of NIC teaming. The concept of teaming goes by many different names: bonding, grouping, and trunking to name a few. Really, it just means that we’re taking multiple physical NICs on a given ESXi host and combining them into a single logical link that provides bandwidth aggregation and redundancy to a vSwitch. You might think that this sounds a little bit like port channels from earlier in the book. And you’re partially right—the goal is very similar, but the methods are vastly different.


  Let’s go over all of the configuration options for NIC teaming within a vSwitch. These options are a bit more relevant when your vSwitch is using multiple uplinks but are still valid configuration points no matter the quantity of uplinks.

Load Balancing

The first point of interest is the load-balancing policy. This is basically how we tell the vSwitch to handle outbound traffic, and there are four choices on a standard vSwitch:
  1. Route based on the originating virtual port
  2. Route based on IP hash
  3. Route based on source MAC hash
  4. Use explicit failover order
Keep in mind that we’re not concerned with the inbound traffic because that’s not within our control. Traffic arrives on whatever uplink the upstream switch decided to put it on, and the vSwitch is only responsible for making sure it reaches its destination.

The first option, route based on the originating virtual port, is the default selection for a new vSwitch. Every VM and VMkernel port on a vSwitch is connected to a virtual port. When the vSwitch receives traffic from either of these objects, it assigns the virtual port an uplink and uses it for traffic. 

The chosen uplink will typically not change unless there is an uplink failure, the VM changes power state, or the VM is migrated around via vMotion.

The second option, route based on IP hash, is used in conjunction with a link aggregation group (LAG), also called an EtherChannel or port channel. When traffic enters the vSwitch, the load-balancing policy will create a hash value of the source and destination IP addresses in the packet. The resulting hash value dictates which uplink will be used.

The third option, route based on source MAC hash, is similar to the IP hash idea, except the policy examines only the source MAC address in the Ethernet frame. To be honest, we have rarely seen this policy used in a production environment, but it can be handy for a nested hypervisor VM to help balance its nested VM traffic over multiple uplinks.


The fourth and final option, use explicit failover order, really doesn’t do any sort of load balancing. Instead, the first Active NIC on the list is used. If that one fails, the next Active NIC on the list is used, and so on, until you reach the Standby NICs. Keep in mind that if you select the Explicit Failover option and you have a vSwitch with many uplinks, only one of them will be actively used at any given time. 

Use this policy only in circumstances where using only one link rather than load balancing over all links is desired or required.

Network Failure Detection

When a network link fails (and they definitely do), the vSwitch is aware of the failure because the link status reports the link as being down. This can usually be verified by seeing if anyone tripped over the cable or mistakenly unplugged the wrong one. 

In most cases, this is good enough to satisfy your needs and the default configuration of “link status only” for the network failure detection is good enough.
But what if you want to determine a failure further up the network, such as a failure beyond your upstream connected switch? This is where beacon probing might be able to help you out. Beacon probing is actually a great term because it does roughly what it sounds like it should do. 

A beacon is regularly sent out from the vSwitch through its uplinks to see if the other uplinks can “hear” it.


Below image shows an example of a vSwitch with three uplinks. When Uplink1 sends out a beacon that Uplink2 receives but Uplink3 does not, this is because the upstream aggregation switch 2 is down, and therefore, the traffic is unable to reach Uplink3.
 
An example where beacon probing finds upstream switch failures
Are you curious why we use an example with three uplinks? Imagine you only had two uplinks and sent out a beacon that the other uplink did not hear. Does the sending uplink have a failure, or does the receiving uplink have a failure? It’s impossible to know who is at fault. Therefore, you need at least three uplinks in order for beacon probing to work.

 NOTE

Notify Switches

The Notify Switches configuration is a bit mystifying at first. Notify the switches about what, exactly? By default, it’s set to “Yes,” and as we cover here, that’s almost always a good thing.

Remember that all of your upstream physical switches have a MAC address table that they use to map ports to MAC addresses. This avoids the need to flood their ports—which means sending frames to all ports except the port they arrived on (which is the required action when a frame’s destination MAC address doesn’t appear in the switch’s MAC address table).

But what happens when one of your uplinks in a vSwitch fails and all of the VMs begin using a new uplink? The upstream physical switch would have no idea which port the VM is now using and would have to resort to flooding the ports or wait for the VM to send some traffic so it can re-learn the new port. 

Instead, the Notify Switches option speeds things along by sending Reverse Address Resolution Protocol (RARP) frames to the upstream physical switch on behalf of the VM or VMs so that upstream switch updates its MAC address table. This is all done before frames start arriving from the newly vMotioned VM, the newly powered-on VM, or from the VMs that are behind the uplink port that failed and was replaced.

These RARP announcements are just a fancy way of saying that the ESXi host will send out a special update letting the upstream physical switch know that the MAC address is now on a new uplink so that the switch will update its MAC address table before actually needing to send frames to that MAC address. It’s sort of like ESXi is shouting to the upstream physical switch and saying, “Hey! This VM is over here now!”

Failback

Since we’re already on the topic of an uplink failure, let’s talk about Failback. If you have a Standby NIC in your NIC Team, it will become Active if there are no more Active NICs in the team. Basically, it will provide some hardware redundancy while you go figure out what went wrong with the failed NIC.

 When you fix the problem with the failed Active NIC, the Failback setting determines if the previously failed Active NIC should now be returned to Active duty.

If you set this value to Yes, the now-operational NIC will immediately go back to being Active again, and the Standby NIC returns to being Standby. Things are returned back to the way they were before the failure.

If you choose the No value, the replaced NIC will simply remain inactive until either another NIC fails or you return it to Active status.

Failover Order

The final section in a NIC team configuration is the failover order. It consists of three different adapter states:
  • Active adapters: Adapters that are Actively used to pass along traffic.
  • Standby adapters: These adapters will only become Active if the defined Active adapters have failed.
  • Unused adapters: Adapters that will never be used by the vSwitch, even if all the Active and Standby adapters have failed.
While the Standby and Unused statuses do have value for some specific configurations, such as with balancing vMotion and management traffic on a specific pair of uplinks, it’s common to just set all the adapters to Active and let the load-balancing policy do the rest.

VMFS volume on the VMware ESX/ESXi host is locked due to an I/O error.

Tuesday, June 14, 2016 0
If naa.60060160b3c018009bd1e02f725fdd11:1 represents one of the partitions used in a VMFS volume, you see this message when the VMFS volume is inaccessible:
volume on device naa.60060160b3c018009bd1e02f725fdd11:1 locked, possibly because remote host 10.17.211.73 encountered an error during a volume operation and couldn’t recover.

If this issue occurs, the VMFS volume (and the virtual machines residing on the affected volume) are unavailable to the ESX/ESXi host.
In the /var/log/vmkernel.log file, you may see similar message indicating the same issue:
WARNING: LVM: 13127: The volume on the device naa.6000eb3b3638efa50000000000000258:1 locked, possibly because some remote host encountered an error during a volume operation and could not recover.
LVM: 11786: Failed to open device naa.6000eb3b3638efa50000000000000258:1 : Lock was not free

To resolve this issue, remove the lock on the indicated volume.
  1. Log in to the ESX/ESXi console.
    • For information on how to log in to ESXi 4.1 and 5.x hosts
    • For information on how to log in to ESXi 4.0, see 
  2. Log in to the terminal of the VMware ESX or ESXi host and run these commands:

    To break the lock:
    1. Break the existing LVM lock on the datastore by running this command:
      # vmkfstools –B vmfs deviceNote: You can also use the parameter --breaklock instead of -B with the vmkfstools command.

      From the preceding error message, this command is used:

      # vmkfstools -B /vmfs/devices/disks/naa.60060160b3c018009bd1e02f725fdd11:1You see output similar to:

      VMware ESX Question:

      LVM lock on device /vmfs/devices/disks/naa.60060160b3c018009bd1e02f725fdd11:1 will be forcibly broken. Please consult vmkfstools or ESX documentation to understand the consequences of this.

      Please ensure that multiple servers aren't accessing this device.

      Continue to break lock?
      0) Yes
      1) No

      Please choose a number [0-1]:
    2. Enter 0 to break the lock.
    3. Re-read and reload VMFS datastore metadata to memory by running this command:

      # vmkfstools –V
    4. From the vSphere UI, refresh the Storage Datastores View under Configuration tab.
Note: This issue can also be resolved by restarting all the hosts in the cluster.

VSphere 6.0 important log files and its locations

Tuesday, June 14, 2016 0
VSphere 6.0 has made some significant changes to the logging locations for its contained vCenter and PSC services. Everything has been condensed into a common area of the directory structure and labeled with the service name. In short, it makes a LOT more sense now than it did before.

This is an overview of what the structure looks like now and where to find what you need.

Windows Log Locations

C:\ProgramData\VMware\vCenterServer\logs


vCenter Appliance Log Locations

/var/log/vmware


vCenter Service

vmware-vpx\vpxd.log
Use this to troubleshoot issues with issues relating directly operation of the vCenter. Everything from DB connectivity problems to vCenter crashes are in here. This log will have a LOT of information in it and is a good place to start on many issues.
 

Inventory Service

invsvc\inv-svc.log
Formally the ds.log in 5.x. The format and location has changed.
invsvc\wrapper.log
Used to troubleshoot why the inventory service will not start.


Single Sign on

sso\vmware-sts-idmd.log
This is a good log to use as a “one-stop-shop” for SSO authentication issues. Authentication requests/failures as well as problems with an identity source will post here. 

vmafd\vdcpromo.log
Contains installation errors during configuration of vmdir. Especially useful for errors when adding another PSC to the same SSO domain.

vmdird\vmdird-syslog.log
Has information concerning the SSO LDAP instance named vmdir. Problems with ldap operations and replication within SSO can be found here.


vPostgres Service

vpostgres\postgresql-##.log
 
Operational information about the local vPostgres instance. This is just a renamed version on pg_log in normal Postgresql.


vSphere Web Client

vsphere-client\logs\vsphere_client_virgo.log
 
An excellent source of information when troubleshooting errors within the Web Client. If you receive errors from simply clicking on objects, you begin chasing them down here!

vsphere-client\wrapper.log
 
Entries in here can help determine why your vSphere Web Client service won’t start, or if it suddenly crashes. This log will not have as much on issues received while inside the Web Client
 

VMware System and Hardware Health Manager

vws\wrapper.log
This service is used to poll ESXi hosts for IPMI information for the Hardware Status tab. Entries in here can determine why the service won’t start, is malfunctioning, or if it suddenly crashes.


Performance Charts

perfcharts\stats.log
 
Has information on the Performance Charts section of the vCenter. If the charts fail to load, look here first.


Explain about vCenter operation times out with the error: Operation failed since another task is in progress

Tuesday, June 14, 2016 0

The default time-outs in VMware Infrastructure (VI) Client may not be long enough for certain long operations, such as deleting snapshots. This article provides information on how to prevent these timeouts. 

vCenter Server has a default 15 minute timeout for any task. Starting with the vCenter 2.5 Update 4 release, to prevent vSphere Client from displaying unnecessary timeout error messages, you can configure the timeout values by editing the vpxd.cfg file and the vpxa.cfg file of the source and destination ESXi/ESX host.
Note: If you are using VCB and your backup failed due to a timeout, check your virtual machine for a backup snapshot that has been left behind.

Lengthy Tasks which Time Out

When a task is reported to timeout within vCenter, the task may continue to run in the ESXi/ESX host level. Certain tasks (such as a snapshot consolidation) may take a long time to complete and should not be interrupted.
Note: In the case of snapshot consolidation, even though the vSphere Client timeout occurs, the operation on the ESXi/ESX host is still running. You can verify by observing the .vmdk file for the virtual machine. It is updated every minute which means the delta files are being committed to the .vmdk file.

vCenter Server Timeout Settings

To change the timeout value in the vCenter Server, update vpxd.cfg on vCenter and vpxa.cfg on the ESXi/ESX:
  1. Log in to the vCenter Server with the appropriate permissions.
  2. Open the vpxd.cfg file in a text editor. The default location for the file is:

    C:\Documents and Settings\All Users\Application Data\VMware\VMware VirtualCenter\vpxd.cfg
  3. For Windows 7 and Windows 2008, the default location for the file is:

    C:\ProgramData\VMware\VMware VirtualCenter\vpxd.cfg
  4. To increase the timeout values for the virtual machine migration task, add the following timeout parameter in the vpxd.cfg file:

    <config>
    ...
    <task>
    <timeout>10800</timeout>
    </task>
    ...
    </config>

    Note: The value 10800 can be changed based on your requirements. This example uses 10800 seconds, or 3 hours.
  5. To increase the SOAP layer blocking call timeout, add the following values in the vpxd.cfg file:

    <config>
    ...
    <vmomi>
    <soapStubAdapter>
    <blockingTimeoutSeconds>10800</blockingTimeoutSeconds>
    </soapStubAdapter>
    </vmomi>
    ...
    </config>
    Note: The value 10800 can be changed based on your requirements. This example uses 10800 seconds, or 3 hours. This line may not be present in ESX 4.0.
  6. Restart the vCenter Server service. 

ESXi/ESX timeout settings

  1. Log in to the ESXi/ESX host as root via the console or an SSH session.
  2. Open the vpxa.cfg file in a text editor.

    By default, this file is located at:
    • ESX - /etc/opt/vmware/vpxa/vpxa.cfg
    • ESXi - /etc/vmware/vpxa/vpxa.cfg
    .
  3. To increase the timeout values for the virtual machine migration task (both source and destination hosts), add the following timeout parameter in the vpxa.cfg file:

    <config>
    ...
    <task>
    <timeout>10800</timeout>
    </task>
    ...
    </config>
  4. To increase the SOAP layer blocking call timeout, add these values in the vpxa.cfg file :

    <config>
    ...
    <vmomi>
    <soapStubAdapter>
    <blockingTimeoutSeconds>10800</blockingTimeoutSeconds>
    </soapStubAdapter>
    </vmomi>
    ...
    </config>
    Note: The value 10800 can be changed based on your requirements. This example uses 10800 seconds or 3 hours.
  5. Configure the timeout value for the time that vCenter Server waits to capture the virtual machine's ID at ESX/ESXi destination. Add a new configurable parameter in the vpxa.cfg file:

    <config>
    ...
    <vpxa>
    ...
    <vmotion>
    <vmIdAcquireTimeout>600</vmIdAcquireTimeout>
    </vmotion>
    ...
    </vpxa>
    ...
    </config>
    Note: The value 600 can be changed based on your requirements. This example uses 600 seconds or 10 minutes.
  6. Restart the vmware-vpxa service on the ESXi/ESX host. 

How to change the database password in Update Manager 4.1 Update 1, 5.x and 6.0

Tuesday, June 14, 2016 0

To change the database password in Update Manager 4.1 Update 1, 5.x and 6.0

    Navigate to the directory where Update Manager is installed. The default location is:
  •     C:\Program Files (x86)\VMware\Infrastructure\Update Manager\.
  •     Launch VMwareUpdateManagerUtility.exe.
  •     Use an account with administrator privileges on vCenter Server to log in to the utility.
  •     Click Database Settings.
  •     Type your new username and password in the appropriate fields.
  •     Click Apply.
  •     Close the VMware vCenter Update Manager utility.
  •     Restart the VMware vCenter Update Manager service.

Changing the vCenter Server database user ID and password

Tuesday, June 14, 2016 0

To change the vCenter Server user ID for SQL database connections for vCenter Server 5.x and earlier: 

Note: Before making any registry modifications, ensure that you have a current and valid backup of the registry.

    Take a full backup of the registry prior to editing it. Do not skip this step.
    Click Start > Run, type regedit and click OK.
    In the Windows Registry Editor, navigate to:
        HKEY_LOCAL_MACHINE\SOFTWARE\VMware, Inc.\VMware VirtualCenter\DB (under My Computer)
        For 32-bit versions of vCenter Server running on 64-bit versions of Windows:

        HKEY_LOCAL_MACHINE\SOFTWARE\Wow6432Node\VMware, Inc.\VMware VirtualCenter\DB

For vCenter Server 5.0

        HKEY_LOCAL_MACHINE\SOFTWARE\VMware, Inc.\VMware VirtualCenter\DB

        Note: To see these keys in a 32-bit version of the Registry Editor in a 64-bit operating system, click Start > Run, type %systemroot%\syswow64\regedit, and click OK.

    Right-click 2 and click Modify.
    Enter the database user ID in the Value data field.
    Click OK.

To change the vCenter Server user ID for SQL database connections for vCenter Server 6.0:

    Stop the vCenter Server service.
    Navigate to: C:\ProgramData\VMware\vCenterServer\cfg\vmware-vpx.
    Take a backup copy of vpxd.cfg.
    Open vpxd.cfg in a text editor.
    Locate the <DB> element and modify the value for <key_2> to reflect the new database user ID.     ...
    <DB>
    <key_2>database_user_id</key2>
    <key_3>*joqDY/eQvwyLBdLcXXJYZvDAd+FXYY8q7x///vhy4LE=</key_3>
    </DB>
    ...
    If you are using Windows Integrated Authentication to connect to the vCenter Server database, remove the value for <key_3>.
    Save vpxd.cfg.
    Start the vCenter Server service.

    Note: If the vCenter Server database password has changed, follow the steps below to update the vCenter Server database password before starting the vCenter Server service.

To update the password used by the vCenter Server for database connections to the SQL Database, use one of these options:

Follow these steps in VMware Infrastructure (VI) Client for VirtualCenter 2.5 only

        Click Administration > VirtualCenter Management Server Configuration.
        Click Database.
        In the Database Setting page, enter the new password in the Password field.
        Click OK.
    For VirtualCenter 2.5 Update 2 and later, the -p command line flag sets the database password in vCenter Server:
        Click Start, right-click Command Prompt, and select Run as administrator to open a command prompt as an administrator.
        Run this command: 

For vCenter Server 5.5 and earlier

        C:\Program Files\VMware\Infrastructure\VirtualCenter Server\vpxd.exe -p
        For vCenter Server 6.0:

        C:\Program Files\VMware\vCenter Server\vpxd\vpxd.exe -p

        Note:This is the default path to the vCenter Server installation directory. Change the path appropriately, if required.
        Enter a new password when prompted.

        Note: If changing any SQL authentication modes or credentials (for example, changing from SQL to Windows authentication), ensure that the ODBC System DSN utilized for the vCenter Server database connection is also updated to reflect the credential changes.

        Restart the vCenter Server service.

Stages of Linux Boot Process

Tuesday, June 14, 2016 0

The following are the 6 high level stages of a typical Linux boot process.

1. BIOS

    BIOS stands for Basic Input/Output System
    Performs some system integrity checks
    Searches, loads, and executes the boot loader program.
    It looks for boot loader in floppy, cd-rom, or hard drive. You can press a key (typically F12 of F2, but it depends on your system) during the BIOS startup to change the boot sequence.
    Once the boot loader program is detected and loaded into the memory, BIOS gives the control to it.
    So, in simple terms BIOS loads and executes the MBR boot loader.

2. MBR

    MBR stands for Master Boot Record.
    It is located in the 1st sector of the bootable disk. Typically /dev/hda, or /dev/sda
    MBR is less than 512 bytes in size. This has three components 1) primary boot loader info in 1st 446 bytes 2) partition table info in next 64 bytes 3) mbr validation check in last 2 bytes.
    It contains information about GRUB (or LILO in old systems).
    So, in simple terms MBR loads and executes the GRUB boot loader.

3. GRUB

    GRUB stands for Grand Unified Bootloader.
    If you have multiple kernel images installed on your system, you can choose which one to be executed.
    GRUB displays a splash screen, waits for few seconds, if you don’t enter anything, it loads the default kernel image as specified in the grub configuration file.
    GRUB has the knowledge of the filesystem (the older Linux loader LILO didn’t understand filesystem).
    Grub configuration file is /boot/grub/grub.conf (/etc/grub.conf is a link to this). The following is sample grub.conf of CentOS.

    #boot=/dev/sda
    default=0
    timeout=5
    splashimage=(hd0,0)/boot/grub/splash.xpm.gz
    hiddenmenu
    title CentOS (2.6.18-194.el5PAE)
              root (hd0,0)
              kernel /boot/vmlinuz-2.6.18-194.el5PAE ro root=LABEL=/
              initrd /boot/initrd-2.6.18-194.el5PAE.img

    As you notice from the above info, it contains kernel and initrd image.
    So, in simple terms GRUB just loads and executes Kernel and initrd images.

4. Kernel

    Mounts the root file system as specified in the “root=” in grub.conf
    Kernel executes the /sbin/init program
    Since init was the 1st program to be executed by Linux Kernel, it has the process id (PID) of 1. Do a ‘ps -ef | grep init’ and check the pid.
    initrd stands for Initial RAM Disk.
    initrd is used by kernel as temporary root file system until kernel is booted and the real root file system is mounted. It also contains necessary drivers compiled inside, which helps it to access the hard drive partitions, and other hardware.

5. Init

    Looks at the /etc/inittab file to decide the Linux run level.
    Following are the available run levels
        0 – halt
        1 – Single user mode
        2 – Multiuser, without NFS
        3 – Full multiuser mode
        4 – unused
        5 – X11
        6 – reboot
    Init identifies the default initlevel from /etc/inittab and uses that to load all appropriate program.
    Execute ‘grep initdefault /etc/inittab’ on your system to identify the default run level
    If you want to get into trouble, you can set the default run level to 0 or 6. Since you know what 0 and 6 means, probably you might not do that.
    Typically you would set the default run level to either 3 or 5.

6. Runlevel programs

    When the Linux system is booting up, you might see various services getting started. For example, it might say “starting sendmail …. OK”. Those are the runlevel programs, executed from the run level directory as defined by your run level.
    Depending on your default init level setting, the system will execute the programs from one of the following directories.
        Run level 0 – /etc/rc.d/rc0.d/
        Run level 1 – /etc/rc.d/rc1.d/
        Run level 2 – /etc/rc.d/rc2.d/
        Run level 3 – /etc/rc.d/rc3.d/
        Run level 4 – /etc/rc.d/rc4.d/
        Run level 5 – /etc/rc.d/rc5.d/
        Run level 6 – /etc/rc.d/rc6.d/
    Please note that there are also symbolic links available for these directory under /etc directly. So, /etc/rc0.d is linked to /etc/rc.d/rc0.d.
    Under the /etc/rc.d/rc*.d/ directories, you would see programs that start with S and K.
    Programs starts with S are used during startup. S for startup.
    Programs starts with K are used during shutdown. K for kill.
    There are numbers right next to S and K in the program names. Those are the sequence number in which the programs should be started or killed.
    For example, S12syslog is to start the syslog deamon, which has the sequence number of 12. S80sendmail is to start the sendmail daemon, which has the sequence number of 80. So, syslog program will be started before sendmail.

That is what happens during the Linux boot process. Thanks for  Reading.