This Blog is to share our knowledge and expertise on Linux System Administration and VMware Administration

Showing posts with label VMware. Show all posts

Friday, November 24, 2017

Update or Recover root password using Host Profiles VMware

Friday, November 24, 2017 0
VMware Update or Recover root password using Host Profiles.
Create the Host Profile


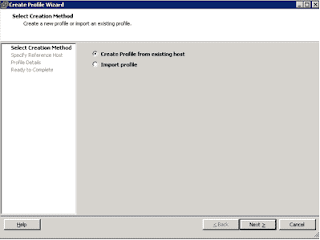
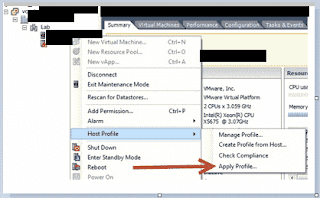
1. Right click any host in your inventory (it doesn’t matter which), choose Host Profile, then Create Profile from Host.


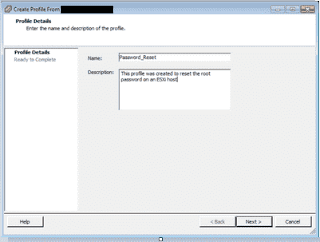
2. Name the Host Profile and give it a description. Click Next.

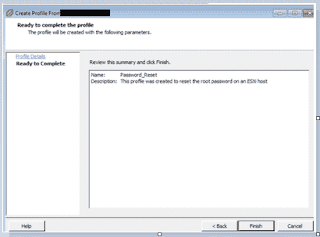
3. Click Finish to create the Host Profile.

Configure the Host Profile
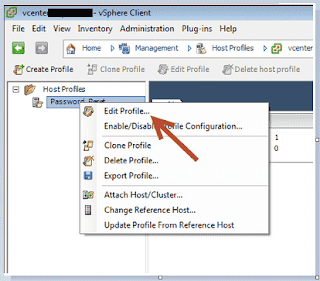
I. Open Host Profiles.


II. Right-click the Host Profile and choose Edit Profile.

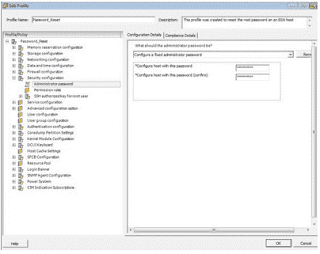
III. Expand Security Configuration, choose Administrator password
    Choose Configure a fixed administrator password, type in the password twice, then click OK.


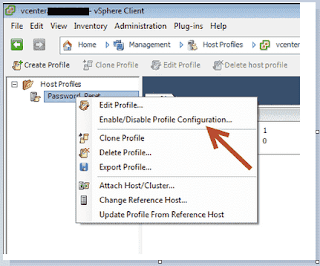
IV. Right-click the Host Profile and choose Enable/Disable Profile Configuration.

V. Uncheck everything in the Host Profile configuration except the Security Configuration, click OK.

a. Apply the Host Profile to the ESXi Host (or vSphere Cluster)

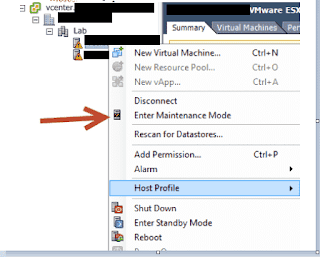
b. Right click any host in your inventory, choose Host Profile, then Manage Profile.

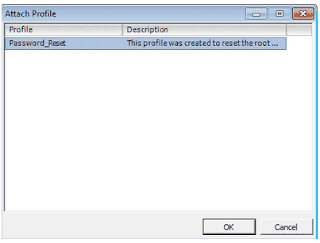
c. Choose the Password_Reset Host Profile, click OK.

d. Right click any host in your inventory, choose Host Profile, then Apply Profile.

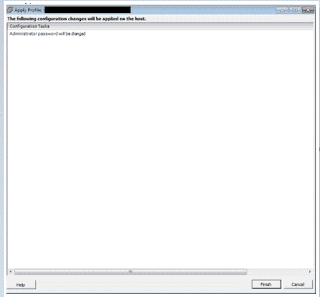
e. Recheck the changes to be applied, click Finish

Log In
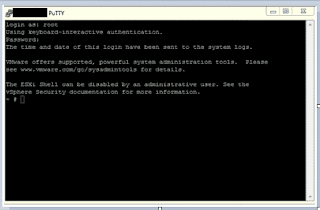
     Log in with the new password. If the setting has been changed successfully, you should be able to log in with the new password immediately.


Sunday, November 12, 2017

Performance collection tools to gather data for fault analysis in VMware

Sunday, November 12, 2017
This article explains how to use performance collection tools to gather data for analysis of faults such as:
    Unresponsive ESX hosts
    Unresponsive virtual machines
    ESX host purple diagnostic screens

Why gather performance data for a fault?

If the diagnostic logs do not help you determine the cause of a fault, you may need to use performance collection tools to gather further data for analysis. Set up performance collections tools to gather data about faults that may occur.

Performance gathering tools

VMware recommends the following tools for gathering performance data: 

top
The top utility provides a list of CPU-intensive tasks for the ESX host Service Console.
Use top in batch mode for Fault troubleshooting by directing the output to a file so that it can be reviewed after a recurrence.


Note: The top command is not available for ESXi.
To run the top utility, run the command:


# top –bc –d <delay in seconds> [–n <iterations>] > output-perf-stats-file.txt

 
Use the information in the output file to identify any trends before the fault. 


esxtop
The esxtop tool provides performance statistics for the entire ESX/ESXi host. It provides details of network, storage, CPU, and memory load from the VMkernel perspective. It provides details on a VMkernel world basis.
esxtop
To collect the data over long periods of time, run esxtop in batch mode. Direct the output to a file so that it can be reviewed after the fault.


To run the esxtop tool, run the command:


# esxtop –b –d <delay in seconds> [-n <iterations>] > output-perf-statistics-file.csv

 
Like esxtop, the resxtop tool provides performance statistics for a specified ESX host in the network. It provides the same performance information as esxtop and may be used either after deploying the VMware vSphere Management Assistant (vMA) virtual appliance or installing the VMware Command-Line Interface (vCLI). 


To run the resxtop tool and collect batch performance data, log into the vMA or open the vCLI, and execute the command:


# resxtop [server] [vihost] [portnumber] [username] -b -d <delay in seconds> [-n <interations>] > output-perf-statistics-file.csv


vm-support -s

 
Use the vm-support command with the -s parameter to collect performance statistics, system configuration information, and logging. Submit the file generated by this command to VMware Support for further assistance, if required. 


Performance Monitor (PERFMON.EXE)

 
Microsoft's Performance Monitor is a utility that comes with every Microsoft Windows NT-based Operating System. This utility can be used to monitor local and remote Microsoft Windows machines. It can log performance data and display data from logs or real-time data.


This utility is useful when reviewing data collected from the esxtop tool and for troubleshooting virtual machine unresponsiveness. When using Performance Monitor for virtual machine unresponsiveness, collect the data remotely from another Microsoft Windows machine so that the utility does not affect the data being gathered.
For more information about Performance Monitor on your specific version of Windows, refer to Microsoft support sites.

Thursday, November 9, 2017

Default Queue Depth values for QLogic HBAs for various ESXi/ESX versions

Thursday, November 09, 2017
This table lists the default Queue Depth values for QLogic HBAs for various ESXi/ESX versions:


The default Queue Depth value for Emulex adapters has not changed for all versions of ESXi/ESX released to date. The Queue Depth is 32 by default, and because 2 buffers are reserved, 30 are available for I/O data.

The default Queue Depth value for Brocade adapters is 32.

Wednesday, November 1, 2017

Extracting the log file after an ESX or ESXi host fails with a purple screen error

Wednesday, November 01, 2017 0
To resolve this issue, extract the log file from a vmkernel-zdump file using a command line utility on the ESX or ESXi host. This utility differs for different versions of ESX or ESXi.
  • For ESX 3.x use the vmkdump utility:

    # vmkdump -l vmkernel-zdump-filename
  • For ESXi 3.5, ESXi/ESX 4.x and ESXi 5.x, use the esxcfg-dumppart utility:

    # esxcfg-dumppart -L vmkernel-zdump-filename
To extract the log file from a vmkernel-zdump file:
  1. Find the vmkernel-zdump file in the /root/ or /var/core/ directory:

    # ls /root/vmkernel* /var/core/vmkernel*
    /var/core/vmkernel-zdump-073108.09.16.1
  2. Use the vmkdump or esxcfg-dumppart utility to extract the log. For example:

    # vmkdump -l /var/core/vmkernel-zdump-073108.09.16.1
    created file vmkernel-log.1


    # esxcfg-dumppart -L /var/core/vmkernel-zdump-073108.09.16.1
    created file vmkernel-log.1
  3. The vmkernel-log.1 file is plain text, though may start with null characters. Focus on the end of the log, which is similar to:

    VMware ESX Server [Releasebuild-98103]
    PCPU 1 locked up. Failed to ack TLB invalidate.
    frame=0x3a37d98 ip=0x625e94 cr2=0x0 cr3=0x40c66000 cr4=0x16c
    es=0xffffffff ds=0xffffffff fs=0xffffffff gs=0xffffffff
    eax=0xffffffff ebx=0xffffffff ecx=0xffffffff edx=0xffffffff

    ...
  4. For troubleshooting the cause of the purple diagnostic screen, see Vmware articles.
Note: The file name created for the log in this example is vmkernel-log.1. If another file with the same name already exists, the new file is created with the number suffix incremented.

How to collect Diagnostic information for VMware Data Protection?

Wednesday, November 01, 2017 0


Purpose
VMware Technical Support routinely requests diagnostic information from you when a support request is handled. This diagnostic information contains product specific logs and configuration files from the host on which the product is run. The information is gathered using a specific script or tool for each product.

This article provides procedures for obtaining diagnostic information for VMware Data Protection (VDP)..
Resolution
To gather the VDP 5.1 logs:
  1. Open a supported browser and type:

    https://IP_addressVDP_Appliance:8543/vdp-configure/
  2. Log in with the VDP user name and password.
  3. Click the Status tab.
  4. In the Log Collector section, click Collect logs. A Save as dialogue appears that allows you to download the log bundle to the file system of the machine in which your web browser is running. The default location is the current download directory of your browser.
Note: By default the log bundle is named as LogBundle.zip, but ensure to give a unique name.
To gather the VDP 5.5.x logs:
  1. Open a web browser and type:

    https://IP_address_VDP_Appliance:8543/vdp-configure/
  2. Log in with the VDP user name and password.
  3. Click the Status tab.
  4. Depending on the type of log information you want to collect, download one of these files:
    • Log bundle:
      • Click Collect all logs to download a zip file that contains all logs from VDP services. A Save as dialog appears that allows you to download the log bundle to the file system of the machine in which your web browser is running. The default location is the current download directory of your browser.

        Note: By default, the log bundle is named as
        LogBundle.zip, but ensure to give a unique name.
    • Client logs:
      • Click Collect client logs to download an aggregated text file that contains all client failure logs.
To gather the VDP 5.8 logs:
  1. Open a web browser and type:

    https://IP_address_VDP_Appliance:8543/vdp-configure/
  2. Log in with the VDP user name and password.
  3. Click the Log collector tab.
  4. Depending on the type of log information you want to collect, download one of these files:
    • Log bundle:
      • Click All VDP Appliance logs to download a zip file that contains all logs from VDP services. A Save as dialog appears that allows you to download the log bundle to the file system of the machine in which your web browser is running. The default location is the current download directory of your browser.

        Note: By default, the log bundle is named
        LogBundle.zip, but ensure to give a unique name.
    • Client logs:
      • Click Collect client logs to download an aggregated text file that contains all client failure logs.
    • External proxy logs:
      • Click Collect external proxy logs to download an aggregated .zip file that contains all external proxy logs.

To gather the VDP 6.0 logs:
  1. Open a web browser and type:

    https://IP_address_VDP_Appliance:8543/vdp-configure/
  2. Log in with the VDP username and password.
  3. Click the Log Collector tab.
  4. Select one or more checkboxes to download log files:
    • To download all log files to a zip file, select All VDP Appliance Logs and click Download to save all log files from VDP services to a .zip file.
      The Select location for download dialog box appears.By default, the log bundle is named
      LogBundle.zip. Rename the file to a unique name.
    • To download all logs under a specific heading, select a checkbox next to a heading, and then click Download:
      • Core VDP Service
      • Management Service
      • File System Service
      • File Level Restore Service
      • Replication
      • Image Backup and Restore
    • To download log files listed under multiple headings, select the checkbox next to one of more log files, and then click Download.
    • In the Client Logs group box, click Download to download an aggregated text file which contains all client failure logs.
    • In the Configurations group box, click Download to download only VDP configuration file information.